Load Forecasting
Table of Contents
1. NYISO Data
We can pull real-time load data from the following URL. The example URL pulls data for May 2022.
http://mis.nyiso.com/public/csv/pal/20220501pal_csv.zip
Let's create a function that will pull data for a month and process it forecast. It has to:
- Download the file
- Unzip it
- Concatenate the individual DataFrames into one
import urllib.request
import zipfile
import pandas as pd

def get_data(month):    # in yyyymm format
    url = "http://mis.nyiso.com/public/csv/pal/" + str(month) + "01pal_csv.zip"
# download the zip file
    filename, headers = urllib.request.urlretrieve(url)

# extract the csv files from the zip
    with zipfile.ZipFile(filename, "r") as zip_ref:
        csv_filenames = [f.filename for f in zip_ref.filelist if f.filename.endswith(".csv")]
        dfs = []
        for csv_filename in csv_filenames:
            # read csv into pandas dataframe
            with zip_ref.open(csv_filename) as csv_file:
                df = pd.read_csv(csv_file)
                dfs.append(df)

    # concatenate the dataframes into a single dataframe
    df_concatenated = pd.concat(dfs)
    df_concatenated.set_index('Time Stamp', drop=True, inplace=True)

    return(df_concatenated)
mar23 = get_data("202303")
mar23
                    Time Zone    Name   PTID       Load
Time Stamp
03/01/2023 00:00:00       EST  CAPITL  61757  1226.9684
03/01/2023 00:00:00       EST  CENTRL  61754  1722.6571
03/01/2023 00:00:00       EST  DUNWOD  61760   596.3434
03/01/2023 00:00:00       EST  GENESE  61753  1008.5693
03/01/2023 00:00:00       EST  HUD VL  61758  1013.8084
...                       ...     ...    ...        ...
03/31/2023 23:55:00       EDT  MHK VL  61756   713.8065
03/31/2023 23:55:00       EDT  MILLWD  61759   279.8333
03/31/2023 23:55:00       EDT  N.Y.C.  61761  4579.5044
03/31/2023 23:55:00       EDT   NORTH  61755   658.6137
03/31/2023 23:55:00       EDT    WEST  61752  1477.0037

[100881 rows x 4 columns]
## save the data so we don't have to run every time
mar23.to_csv("./mar23.csv")
None
Below are functions to filter by Name and visualize:
def one_location_time_series(df, name):
    return(df[df['Name'] == name]['Load'])

one_location_time_series(mar23, 'NORTH')
Time Stamp
03/01/2023 00:00:00    705.3594
03/01/2023 00:05:00    706.4240
03/01/2023 00:10:00    699.5104
03/01/2023 00:15:00    686.3651
03/01/2023 00:20:00    702.8407
                         ...
03/31/2023 23:42:23    659.7048
03/31/2023 23:43:47    662.0710
03/31/2023 23:45:00    660.0018
03/31/2023 23:50:00    653.6038
03/31/2023 23:55:00    658.6137
Name: Load, Length: 9171, dtype: float64
def elec_plot(df, name):
    one_location_time_series(df, name).plot.line()
    plt.savefig('line_plot.png')
    plt.close()
elec_plot(mar23, 'NORTH')
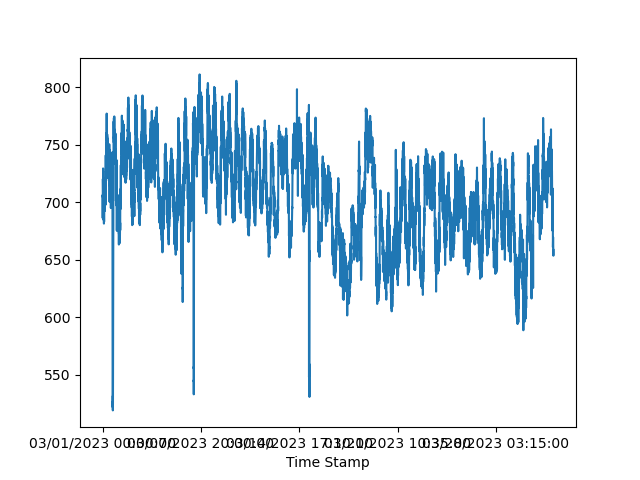
Figure 1: Load (in MW) Time Series