An Introduction to Futures
Table of Contents
- 1. Futures and Forwards
- 2. Who Trades Futures?
- 3. Hedgers
- 4. The Role of Speculators
- 5. CFTC COT Reports
- 6. Major Futures Markets
- 7. Futures Quotes
- 8. Profit and Loss on Futures
- 9. Marking to Market and Margin
- 10. Understanding Futures Prices
- 11. Futures Prices by Delivery
- 12. Open Interest
- 13. Contango and Backwardation
- 14. Contango, the Roll, and Commodity ETFs
- 15. Some Interesting Contracts
1. Futures and Forwards
Futures and forwards are used by firms in the same way in order to manage risk. Futures and forwards simply differ in the manner in which they are traded, and the standardization of the contract.
- In this presentation we'll refer to futures, but much of the content can be generalized to forwards also.
1.1. Spot Prices
The spot price is the price for immediate delivery of the underlying. Usually, immediate means withing two days.
As the futures contract approaches expiration, the futures price approaches the spot price.
2. Who Trades Futures?
Broadly speaking, there are two types of traders in futures markets, hedgers and speculators.
- Hedgers: Companies who use futures to manage risk. They generally buy futures contract on product they consume, and sell contracts on products they produce.
- Speculators: Individuals and firms who trade futures contracts based on expectations of future prices. This is risk taking behavior.
3. Hedgers
3.1. Example: Natural Gas Futures
3.1.1. Buy Natural Gas Futures
Say you are a deregulated utility which operates a natural-gas fired power plant. Your business requires you to buy natural gas and sell electricity. So you are naturally short natural gas, and should buy futures to hedge.
3.1.2. Sell Natural Gas Futures
Say you are an upstream Oil and Gas E&P (Exploration and Production) firm. You produce natural gas, and so are naturally long the price. To hedge you should sell futures.
3.2. Example: Wheat Futures
3.2.1. Buy Wheat Futures
Say you make cereal made from wheat. Your business is naturally short wheat, and so you buy wheat futures to hedge.
3.2.2. Sell Wheat Futures
A farmer's business is long wheat, and therefore the farmer sells wheat futures to hedge. This ensures sufficient future income to cover present costs.
4. The Role of Speculators
Speculators play an important role by taking the other side of order imbalances between hedgers. Without speculators, hedgers would have to wait for other hedgers to trade (causing the market maker to widen bid-ask spreads).
Speculators temporarily hold the order imbalance between hedgers in exchange for a return.
Futures markets exist to allow hedging, and not for speculation. That said, without speculators the futures markets would be more likely to fail because transaction costs (bid-ask spread) would increase.
5. CFTC COT Reports
Types of traders and their aggregate positions are summarized in the [CFTC Commitment of Traders Report](http://www.cftc.gov/Marketreports/CommitmentsofTraders/index.htm).
You can automatically import this data for analysis using:
library(readr)
data <- read_csv("https://www.cftc.gov/dea/newcot/c_disagg.txt", col_names = FALSE)
print(dim(data))
## just show first two rows, and first 5 columns
data[1:2, 1:5]
| X1 | X2 | X3 | X4 | X5 |
|---|---|---|---|---|
| WHEAT-SRW - CHICAGO BOARD OF TRADE | 200407 | 2020-04-07 | 1602 | CBT |
| BLACK SEA WHEAT FINANCIAL - CHICAGO BOARD OF TRADE | 200407 | 2020-04-07 | 00160F | CBT |
Although we have to add the data headings, which it looks like we can get here.
5.1. Quandl
We can also pull this data via Quandl:
5.1.1. TRANSCO ZONE 6 MONTHLY INDEX (IFED) - Futures and Options - Number of Traders
library(Quandl)
api_key <- read.table("~/quandl_api_key")
api_key <- as.character(api_key$V1)
Quandl.api_key(api_key)

cot <- Quandl("CFTC/0233CV_FO_L_ALL_NT")
head(cot)
| Date | Total Traders | Non Commercial Longs | Non Commercial Shorts | Non Commercial Spreads | Commercial Longs | Commercial Shorts | Total Reportable Longs | Total Reportable Shorts |
|---|---|---|---|---|---|---|---|---|
| 2020-03-31 | 21 | 1 | 0 | 0 | 11 | 12 | 12 | 12 |
| 2020-03-24 | 20 | 1 | 0 | 0 | 10 | 12 | 11 | 12 |
| 2020-03-03 | 21 | 2 | 0 | 0 | 10 | 10 | 12 | 10 |
| 2020-02-25 | 21 | 2 | 0 | 0 | 10 | 11 | 12 | 11 |
| 2020-02-04 | 20 | 2 | 1 | 1 | 9 | 11 | 11 | 13 |
| 2020-01-28 | 20 | 2 | 1 | 1 | 10 | 11 | 12 | 13 |
5.2. CME COT Visualizations
6. Major Futures Markets
- CME Group: Comprises the Chicago Mercantile Exchange, Chicago Board of Trade, New York Mercantile Exchange, COMEX, and the CME Europe.
- Intercontinental Exchange
- Chicago Board Options Exchange
7. Futures Quotes
| Contract Size | 5,000 bushels |
| Price Quotation | Cents per Bushel |
| Minimum Tick | 1/4 of one cent per bushel ($12.50) |
| Settlement | Physical Delivery |
| What can be delivered? | #2 Yellow at contract price, #1 Yellow at a 6 cent/bushel premium, #3 Yellow at a 6 cent/bushel discount |
| Where is it delivered? | Try and find the answer in the Full Contract Specifications |
NYMEX Heating Oil Contract (HO)
| Contract Size | 42,000 gallons |
| Price Quotation | Dollars and Cents |
| Minimum Tick | One hundreth of a cent ($4.20) |
| Settlement | Physical Delivery |
| What can be delivered? | Try and find the answer in the Full Contract Specifications |
| Where is it delivered? | Try and find the answer in the Full Contract Specifications |
8. Profit and Loss on Futures
The contract size will give you the profit/loss for a 1 cent movement in the price.
8.1. Soybeans
The soybeans (ZS) contract size is 5000 bushels. So for every cent change in the soybeans contract price, you make or lose $50 per contract.
8.1.1. Example:
Say earlier today you bought 3 July 2020 ZS contracts for 325 cents each. At the close of today's trading July 2020 ZS traded at a price of 327 cents.
Your profit per contract is:
\[(F_{t} - F_{0}) * Contract\ Size = $0.02 * 5000 = $100\]
And since you have 3 contracts, your total profit is $300.
Input a new ZS price (in cents per bushel):
Your profit is: ${{ result }}
8.2. Heating Oil
The NYMEX Heating Oil contract (ticker HO) is for 42000 gallons (there are 42 gallons in a barrel of oil, and each NYMEX crude oil contract is for 1000 barrels). Thus for every cent change in HO, you gain or lose $420. Or equivalently, for every $0.0001 change in HO (the minimum price fluctuation) you gain or lose $4.20.
8.2.1. Example:
Say earlier today you sold 2 June 2020 HO contracts for $1.20 each. At the close of today's trading June 2020 HO traded at a price of $1.230.
In this case you lost $126.
9. Marking to Market and Margin
Contracts are marked-to-market daily, and gains and losses are realized.
Maintenance and initial margin are stated in dollars (as opposed to percent). When you open a position you must have sufficient cash to cover the initial margin (initial margin may be the same as maintenance margin).
At the end of each day you have to add cash if your margin amount is below the maintenance margin. If you gained on your contract the case is added to your margin.
9.1. Example:
Consider the above heating oil position above, where you sold 2 June 2020 HO contracts for $1.20 each, and the close of trading the contract traded at a price of $1.230. In this case you lost $126.
Say the initial margin was $10,000, and the maintenance margin is $8,000.
10. Understanding Futures Prices
All futures prices are affected by interest rates. Beyond that, futures prices are driven by storage costs and convenience yields.
11. Futures Prices by Delivery
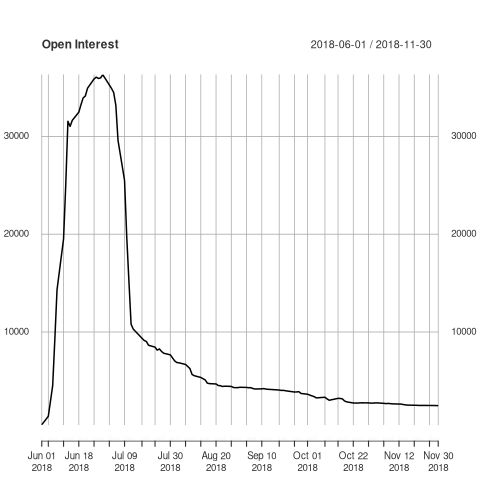
12. Open Interest
For convenience sake, we are inexact when we use the term `buy` or `sell` a futures contract. What we mean when we say `buy` (or `sell`) is we enter into contract today to buy (or sell) the underlying at some set point in the future, for the futures price. So when we buy or sell we create a contract, and if we close a position we remove a contract. The number of contracts that are in existence at any point is call open interest.
## Dubai crude oil traded on the Tokyo commodities exchange
dc <- Quandl("TOCOM/33X2018")
head(dc)
| Date | Open | High | Low | Close | Settle | Volume | Open Interest |
|---|---|---|---|---|---|---|---|
| 2018-11-30 | 46830 | 46830 | 46690 | 46700 | 46700 | 8 | 2471 |
| 2018-11-29 | 47230 | 47230 | 46690 | 46690 | 46690 | 21 | 2476 |
| 2018-11-28 | 46720 | 46970 | 46710 | 46790 | 46790 | 13 | 2483 |
| 2018-11-27 | 46880 | 46890 | 46750 | 46750 | 46750 | 16 | 2485 |
| 2018-11-26 | 47390 | 47390 | 46460 | 46730 | 46730 | 12 | 2489 |
| 2018-11-22 | 47300 | 47350 | 47280 | 47350 | 47350 | 17 | 2492 |
library(xts)
oi <- as.xts(dc$`Open Interest`, order.by = as.Date(dc$Date))
plot(oi, main = "Open Interest")
13. Contango and Backwardation
13.1. Definitions
- Contango: \(F_0 > E(P_T)\) the futures prices are above the expected future spot price.
- Backwardation: \(F_0 < E(P_T)\) the futures prices are below the expected future spot price.
13.2. Explanations
- Keynes/Hicks: hedging demand
- Modern Portfolio Theory
14. Contango, the Roll, and Commodity ETFs
Right now (April 13, 2020) the crude oil market is in contago.
| Month | Last | Change | Prior Settle | Open | High | Low | Volume |
|---|---|---|---|---|---|---|---|
| MAY 2020 | 22.73 | +0.32 | 22.41 | 22.36 | 23.08 | 22.36 | 26,806 |
| JUN 2020 | 29.73 | +0.47 | 29.26 | 29.20 | 29.91 | 29.20 | 12,267 |
| JUL 2020 | 33.45 | +0.49 | 32.96 | 32.93 | 33.57 | 32.93 | 4,802 |
| AUG 2020 | 34.95 | +0.53 | 34.42 | 34.53 | 35.05 | 34.50 | 1,852 |
| SEP 2020 | 35.67 | +0.61 | 35.06 | 35.32 | 35.71 | 35.24 | 672 |
| OCT 2020 | 35.90 | +0.37 | 35.53 | 35.80 | 35.90 | 35.80 | 219 |
| NOV 2020 | 36.61 | +0.67 | 35.94 | 36.22 | 36.61 | 36.22 | 227 |
Every month ETFs such as USO have to sell the front-month contract, and buy the following month. They publish these roll dates here:
When the futures market is in contango, these ETFs lose money every month when they roll, and thus destroy value over time.